


最新下载
热门教程
- 1
- 2
- 3
- 4
- 5
- 6
- 7
- 8
- 9
- 10
iOS实现带指引线的饼状图效果(不会重叠)
时间:2022-06-26 05:47:57 编辑:袖梨 来源:一聚教程网
效果图
先上图(做出来的效果就是下图的样子)
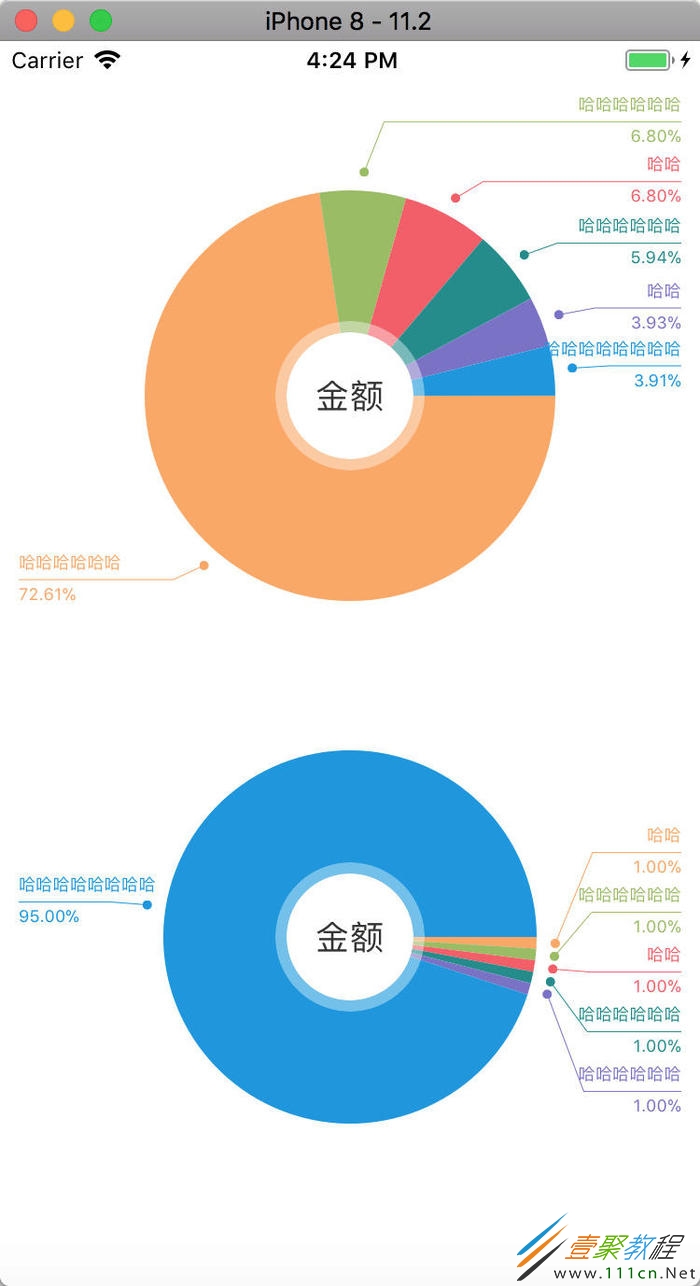
1.效果图-w220
图中不论每个扇形多小,都可以从指引线处将指引的数据分割开来,不会重叠。
第一步
需要给图中数据做个模型
@interface DVFoodPieModel : NSObject
/**
 名称
 */
@property (copy, nonatomic) NSString *name;

/**
 数值
 */
@property (assign, nonatomic) CGFloat value;

/**
 比例
 */
@property (assign, nonatomic) CGFloat rate;
@end
第二步
现在先把饼图中间的圆形做出来,这个没有什么难度,直接贴代码
在.h文件中
@interface DVPieCenterView : UIView
@property (strong, nonatomic) UILabel *nameLabel;
@end
在.m文件中
@interface DVPieCenterView ()
@property (strong, nonatomic) UIView *centerView;
@end
@implementation DVPieCenterView
- (instancetype)initWithFrame:(CGRect)frame {
 if (self = [super initWithFrame:frame]) {
  self.backgroundColor = [[UIColor whiteColor] colorWithAlphaComponent:0.4];
  UIView *centerView = [[UIView alloc] init];
  centerView.backgroundColor = [UIColor whiteColor];
  [self addSubview:centerView];
  self.centerView = centerView;
  UILabel *nameLabel = [[UILabel alloc] init];
  nameLabel.textColor = [UIColor colorWithRed:51/255.0 green:51/255.0 blue:51/255.0 alpha:1];
  nameLabel.font = [UIFont systemFontOfSize:18];
  nameLabel.textAlignment = NSTextAlignmentCenter;
  self.nameLabel = nameLabel;
  [centerView addSubview:nameLabel];
 }
 return self;
}


- (void)layoutSubviews {
 [super layoutSubviews];
 self.layer.cornerRadius = self.frame.size.width * 0.5;
 self.layer.masksToBounds = true;
 self.centerView.frame = CGRectMake(6, 6, self.frame.size.width - 6 * 2, self.frame.size.height - 6 * 2);
 self.centerView.layer.cornerRadius = self.centerView.frame.size.width * 0.5;
 self.centerView.layer.masksToBounds = true;
 self.nameLabel.frame = self.centerView.bounds;
}
暴露的只有.h文件中的namelabel,需要中间显示文字时,给nameLabel的text赋值就好了
第三步
现在就创建一个继承UIView的视图,用来画饼状图和指引线以及数据
在.h文件中需要有数据数组,还有中间显示的文字,以及一个draw方法(draw方法纯属个人习惯,在数据全部赋值完成后,调用该方法进行绘画)
@interface DVPieChart : UIView
/**
 数据数组
 */
@property (strong, nonatomic) NSArray *dataArray;
/**
 标题
 */
@property (copy, nonatomic) NSString *title;
/**
 绘制方法
 */
- (void)draw;
@end
在调用draw方法前应确定数据全部赋值完成,绘制工作其实是在- (void)drawRect:(CGRect)rect方法中完成的,所以.h文件中的draw方法只是来调用系统方法的
在.m文件中,draw方法的实现
- (void)draw {
 [self.subviews makeObjectsPerformSelector:@selector(removeFromSuperview)];
 [self setNeedsDisplay];
}
[self setNeedsDisplay];就是来调用drawRect方法的
[self.subviews makeObjectsPerformSelector:@selector(removeFromSuperview)];这个方法是用来移除添加到pieChart上的centerView,不然每次重绘时都会再次添加一个centerView
下面就是drawRect方法的实现
首先需要确定圆的半径,中心点和起始点
CGFloat min = self.bounds.size.width > self.bounds.size.height ? self.bounds.size.height : self.bounds.size.width;
CGPoint center = CGPointMake(self.bounds.size.width * 0.5, self.bounds.size.height * 0.5);
CGFloat radius = min * 0.5 - CHART_MARGIN;
CGFloat start = 0;
CGFloat angle = 0;
CGFloat end = start;
CHART_MARGIN是自己定义的一个宏,圆不能让视图的边形成切线,在此我把CHART_MARGIN设定为60
* 根据产品的需求,当请求回来的数据为空时,显示一个纯色的圆,不画指引线,所以在drawRect中分两种情况来实现
```objc
if (self.dataArray.count == 0) {

} else {

}
```
* 当dataArray的长度为0时

```objc
if (self.dataArray.count == 0) {

 end = start + M_PI * 2;

 UIColor *color = COLOR_ARRAY.firstObject;

 UIBezierPath *path = [UIBezierPath bezierPathWithArcCenter:center radius:radius startAngle:start endAngle:end clockwise:true];

 [color set];

 //添加一根线到圆心
 [path addLineToPoint:center];
 [path fill];

}
```
> COLOR_ARRAY是自己设定的一个宏定义,产品要求的饼图份数是6份,每份颜色一定,所以做一个宏定义存储一下(做成变量都是可以的,看自己代码风格)

``` objc
#define COLOR_ARRAY @[
[UIColor colorWithRed:251/255.0 green:166.9/255.0 blue:96.5/255.0 alpha:1],
[UIColor colorWithRed:151.9/255.0 green:188/255.0 blue:95.8/255.0 alpha:1],
[UIColor colorWithRed:245/255.0 green:94/255.0 blue:102/255.0 alpha:1],
[UIColor colorWithRed:29/255.0 green:140/255.0 blue:140/255.0 alpha:1],
[UIColor colorWithRed:121/255.0 green:113/255.0 blue:199/255.0 alpha:1],
[UIColor colorWithRed:16/255.0 green:149/255.0 blue:224/255.0 alpha:1]
]
```
* 当dataArray的长度不为0时
```objc

for (int i = 0; i < self.dataArray.count; i++) {
 DVFoodPieModel *model = self.dataArray[i];
 CGFloat percent = model.rate;
 UIColor *color = COLOR_ARRAY[i % 6];
 start = end;
 angle = percent * M_PI * 2;
 end = start + angle;
 UIBezierPath *path = [UIBezierPath bezierPathWithArcCenter:center radius:radius startAngle:start endAngle:end clockwise:true];
 [color set];
 //添加一根线到圆心
 [path addLineToPoint:center];
 [path fill];
}
```
在else中这么做,就能绘制出各个扇形
* 在扇形绘画出来后,添加centerView
```objc
// 在中心添加label
DVPieCenterView *centerView = [[DVPieCenterView alloc] init];
centerView.frame = CGRectMake(0, 0, 80, 80);
CGRect frame = centerView.frame;
frame.origin = CGPointMake(self.frame.size.width * 0.5 - frame.size.width * 0.5, self.frame.size.height * 0.5 - frame.size.width * 0.5);
centerView.frame = frame;
centerView.nameLabel.text = self.title;
[self addSubview:centerView];
```
第四步,绘画指引线和数据
绘制指引线,需要在画扇形时就确定几个数据,并根据这几种数据进行绘制
- 各个扇形圆弧的中心点
- 指引线的重点(效果图中有圆点的位置)
// 获取弧度的中心角度
CGFloat radianCenter = (start + end) * 0.5;
// 获取指引线的终点
CGFloat lineStartX = self.frame.size.width * 0.5 + radius * cos(radianCenter);
CGFloat lineStartY = self.frame.size.height * 0.5 + radius * sin(radianCenter);
CGPoint point = CGPointMake(lineStartX, lineStartY);
因为这个图刚刚做出来时是有重叠的,按产品需求进行更改,所以起的变量名称会有些歧义,不方便改了,我只能做好注释,大家以注释为准
如果按顺序进行绘制的话,那么很难让指引线的位置不重叠,所以从中间的一个数据先进行绘制,然后在绘制中间数据两侧的数据
那么,现在需要将上面需要确定的数据依次添加到一个数组中
例:原数据为@[@1, @2, @3, @4, @5, @6]
画指引线时则需要数据这样来弄@[@3, @2, @1, @4, @5, @6]
所以for循环中应该改成这个样子
注意,数据变更顺序了之后,绘制时模型数据和颜色数据也需要变更顺序
首先声明两个变量
@interface DVPieChart ()
@property (nonatomic, strong) NSMutableArray *modelArray;
@property (nonatomic, strong) NSMutableArray *colorArray;
@end
else中变成下面这个样子
NSMutableArray *pointArray = [NSMutableArray array];
NSMutableArray *centerArray = [NSMutableArray array];
self.modelArray = [NSMutableArray array];
self.colorArray = [NSMutableArray array];
for (int i = 0; i < self.dataArray.count; i++) {
 DVFoodPieModel *model = self.dataArray[i];
 CGFloat percent = model.rate;
 UIColor *color = COLOR_ARRAY[i];
 start = end;
 angle = percent * M_PI * 2;
 end = start + angle;
 UIBezierPath *path = [UIBezierPath bezierPathWithArcCenter:center radius:radius startAngle:start endAngle:end clockwise:true];
 [color set];
 //添加一根线到圆心
 [path addLineToPoint:center];
 [path fill];
 // 获取弧度的中心角度
 CGFloat radianCenter = (start + end) * 0.5;
 // 获取指引线的终点
 CGFloat lineStartX = self.frame.size.width * 0.5 + radius * cos(radianCenter);
 CGFloat lineStartY = self.frame.size.height * 0.5 + radius * sin(radianCenter);
 CGPoint point = CGPointMake(lineStartX, lineStartY);
 if (i <= self.dataArray.count / 2 - 1) {
  [pointArray insertObject:[NSValue valueWithCGPoint:point] atIndex:0];
  [centerArray insertObject:[NSNumber numberWithFloat:radianCenter] atIndex:0];
  [self.modelArray insertObject:model atIndex:0];
  [self.colorArray insertObject:color atIndex:0];
 } else {
  [pointArray addObject:[NSValue valueWithCGPoint:point]];
  [centerArray addObject:[NSNumber numberWithFloat:radianCenter]];
  [self.modelArray addObject:model];
  [self.colorArray addObject:color];
 }
}
for循环中确定了需要的数据:
pointArray、centerArray、self.modelArray、self.colorArray
根据上面确定的数据来绘出指引线,逻辑比较复杂,写一个方法来绘制
- (void)drawLineWithPointArray:(NSArray *)pointArray centerArray:(NSArray *)centerArray
在for循环外调用
// 通过pointArray和centerArray绘制指引线
[self drawLineWithPointArray:pointArray centerArray:centerArray];
第五步
方法内部实现
需要确定的数据都有:
1.指引线长度
2.指引线起点、终点、转折点
3.指引线数据所占的rect范围(用于确定绘制下一个的时候是否有重叠)
下面直接贴出代码实现,注意看注释,我就不在代码外再写一遍了
- (void)drawLineWithPointArray:(NSArray *)pointArray centerArray:(NSArray *)centerArray {
 // 记录每一个指引线包括数据所占用位置的和(总体位置)
 CGRect rect = CGRectZero;
 // 用于计算指引线长度
 CGFloat width = self.bounds.size.width * 0.5;
 for (int i = 0; i < pointArray.count; i++) {
  // 取出数据
  NSValue *value = pointArray[i];
  // 每个圆弧中心店的位置
  CGPoint point = value.CGPointValue;
  // 每个圆弧中心点的角度
  CGFloat radianCenter = [centerArray[i] floatValue];
  // 颜色(绘制数据时要用)
  UIColor *color = self.colorArray[i % 6];
  // 模型数据(绘制数据时要用)
  DVFoodPieModel *model = self.modelArray[i];
  // 模型的数据
  NSString *name = model.name;
  NSString *number = [NSString stringWithFormat:@"%.2f%%", model.rate * 100];

  // 圆弧中心点的x值和y值
  CGFloat x = point.x;
  CGFloat y = point.y;

  // 指引线终点的位置(x, y)
  CGFloat startX = x + 10 * cos(radianCenter);
  CGFloat startY = y + 10 * sin(radianCenter);

  // 指引线转折点的位置(x, y)
  CGFloat breakPointX = x + 20 * cos(radianCenter);
  CGFloat breakPointY = y + 20 * sin(radianCenter);

  // 转折点到中心竖线的垂直长度(为什么+20, 在实际做出的效果中,有的转折线很丑,+20为了美化)
  CGFloat margin = fabs(width - breakPointX) + 20;

  // 指引线长度
  CGFloat lineWidth = width - margin;

  // 指引线起点(x, y)
  CGFloat endX;
  CGFloat endY;

  // 绘制文字和数字时,所占的size(width和height)
  // width使用lineWidth更好,我这么写固定值是为了达到产品要求
  CGFloat number.f;
  CGFloat number.f;

  CGFloat titleWidth = numberWidth;
  CGFloat titleHeight = numberHeight;

  // 绘制文字和数字时的起始位置(x, y)与上面的合并起来就是frame
  CGFloat numberX;// = breakPointX;
  CGFloat numberY = breakPointY - numberHeight;

  CGFloat titleX = breakPointX;
  CGFloat titleY = breakPointY + 2;


  // 文本段落属性(绘制文字和数字时需要)
  NSMutableParagraphStyle * paragraph = [[NSMutableParagraphStyle alloc]init];
  // 文字靠右
  paragraph.alignment = NSTextAlignmentRight;

  // 判断x位置,确定在指引线向左还是向右绘制
  // 根据需要变更指引线的起始位置
  // 变更文字和数字的位置
  if (x <= width) { // 在左边

   endX = 10;
   endY = breakPointY;

   // 文字靠左
   paragraph.alignment = NSTextAlignmentLeft;

   numberX = endX;
   titleX = endX;

  } else { // 在右边

   endX = self.bounds.size.width - 10;
   endY = breakPointY;

   numberX = endX - numberWidth;
   titleX = endX - titleWidth;
  }


  if (i != 0) {

   // 当i!=0时,就需要计算位置总和(方法开始出的rect)与rect1(将进行绘制的位置)是否有重叠
   CGRect rect1 = CGRectMake(numberX, numberY, numberWidth, titleY + titleHeight - numberY);

   CGFloat margin = 0;

   if (CGRectIntersectsRect(rect, rect1)) {
    // 两个面积重叠
    // 三种情况
    // 1. 压上面
    // 2. 压下面
    // 3. 包含
    // 通过计算让面积重叠的情况消除
    if (CGRectContainsRect(rect, rect1)) {// 包含

     if (i % self.dataArray.count <= self.dataArray.count * 0.5 - 1) {
      // 将要绘制的位置在总位置偏上
      margin = CGRectGetMaxY(rect1) - rect.origin.y;
      endY -= margin;
     } else {
      // 将要绘制的位置在总位置偏下
      margin = CGRectGetMaxY(rect) - rect1.origin.y;
      endY += margin;
     }


    } else { // 相交

     if (CGRectGetMaxY(rect1) > rect.origin.y && rect1.origin.y < rect.origin.y) { // 压在总位置上面
      margin = CGRectGetMaxY(rect1) - rect.origin.y;
      endY -= margin;

     } else if (rect1.origin.y < CGRectGetMaxY(rect) && CGRectGetMaxY(rect1) > CGRectGetMaxY(rect)) { // 压总位置下面
      margin = CGRectGetMaxY(rect) - rect1.origin.y;
      endY += margin;
     }

    }
   }
   titleY = endY + 2;
   numberY = endY - numberHeight;


   // 通过计算得出的将要绘制的位置
   CGRect rect2 = CGRectMake(numberX, numberY, numberWidth, titleY + titleHeight - numberY);

   // 把新获得的rect和之前的rect合并
   if (numberX == rect.origin.x) {
    // 当两个位置在同一侧的时候才需要合并
    if (rect2.origin.y < rect.origin.y) {
     rect = CGRectMake(rect.origin.x, rect2.origin.y, rect.size.width, rect.size.height + rect2.size.height);
    } else {
     rect = CGRectMake(rect.origin.x, rect.origin.y, rect.size.width, rect.size.height + rect2.size.height);
    }
   }

  } else {
   rect = CGRectMake(numberX, numberY, numberWidth, titleY + titleHeight - numberY);
  }

  // 重新制定转折点
  if (endX == 10) {
   breakPointX = endX + lineWidth;
  } else {
   breakPointX = endX - lineWidth;
  }

  breakPointY = endY;
  //1.获取上下文
  CGContextRef ctx = UIGraphicsGetCurrentContext();
  //2.绘制路径
  UIBezierPath *path = [UIBezierPath bezierPath];
  [path moveToPoint:CGPointMake(endX, endY)];
  [path addLineToPoint:CGPointMake(breakPointX, breakPointY)];
  [path addLineToPoint:CGPointMake(startX, startY)];
  CGContextSetLineWidth(ctx, 0.5);
  //设置颜色
  [color set];
  //3.把绘制的内容添加到上下文当中
  CGContextAddPath(ctx, path.CGPath);
  //4.把上下文的内容显示到View上(渲染到View的layer)(stroke fill)
  CGContextStrokePath(ctx);

  // 在终点处添加点(小圆点)
  // movePoint,让转折线指向小圆点中心
  CGFloat movePoint = -2.5;
  UIView *view = [[UIView alloc] init];
  view.backgroundColor = color;
  [self addSubview:view];
  CGRect rect = view.frame;
  rect.size = CGSizeMake(5, 5);
  rect.origin = CGPointMake(startX + movePoint, startY - 2.5);
  view.frame = rect;
  view.layer.cornerRadius = 2.5;
  view.layer.masksToBounds = true;

  //指引线上面的数字
  [name drawInRect:CGRectMake(numberX, numberY, numberWidth, numberHeight) withAttributes:@{NSFontAttributeName:[UIFont systemFontOfSize:9.0], NSForegroundColorAttributeName:color,NSParagraphStyleAttributeName:paragraph}];

  // 指引线下面的title
  [number drawInRect:CGRectMake(titleX, titleY, titleWidth, titleHeight) withAttributes:@{NSFontAttributeName:[UIFont systemFontOfSize:9.0],NSForegroundColorAttributeName:color,NSParagraphStyleAttributeName:paragraph}];
 }
}
附github地址:https://github.com/FireMou/DVPieChart (本地下载)
相关文章
- 星际战甲自爆怪怎么打 05-01
- 梦幻西游修业点怎么交易 05-01
- 放置江湖经验怎么刷 05-01
- 光遇如何找到改变体型的药水 05-01
- 攻城掠地宝物属性怎么获得 05-01
- 崩坏星穹铁道折冲妙算唱片在哪折冲妙算唱片位置指引 05-01