


最新下载

热门教程
- 1
- 2
- 3
- 4
- 5
- 6
- 7
- 8
- 9
- 10
python函数运行内存时间等性能检测工具代码示例
时间:2022-06-25 01:13:42 编辑:袖梨 来源:一聚教程网
本篇文章小编给大家分享一下python函数运行内存时间等性能检测工具代码示例,文章代码介绍的很详细,小编觉得挺不错的,现在分享给大家供大家参考,有需要的小伙伴们可以来看看。
基础测试函数
首先,来编写一个基础的python函数用于在后面的各种性能测试。
def base_func():
    for n in range(10000):
        print('当前n的值是:{}'.format(n))
memory_profiler进程
memory_profiler是python的非标准库,所以这里采用pip的方式进行安装。它能够监视进程、了解内存使用等情况。
pip install memory_profiler
安装好memory_profiler库以后,直接使用注解的方式进行测试。
from memory_profiler import profile
@profile
def base_func1():
    for n in range(10000):
        print('当前n的值是:{}'.format(n))
base_func1()
# Line #    Mem usage    Increment  Occurrences   Line Contents
# =============================================================
#     28     45.3 MiB     45.3 MiB           1   @profile
#     29                                         def base_func():
#     30     45.3 MiB      0.0 MiB       10001       for n in range(10000):
#     31     45.3 MiB      0.0 MiB       10000           print('当前n的值是:{}'.format(n))
从返回的数据结果来看,执行当前函数使用了45.3 MiB的内存。
timeit 时间使用情况
timeit是python的内置模块,可以测试单元格的代码运行时间,由于是内置模块所以并不需要单独安装。
import timeit
def base_func2():
    for n in range(10000):
        print('当前n的值是:{}'.format(n))
res = timeit.timeit(base_func2,number=5)
print('当前的函数的运行时间是:{}'.format(res))
# 当前的函数的运行时间是:0.9675800999999993
根据上面函数的运行返回结果,函数的运行时间是0.96秒。
line_profiler行代码检测
如果在只需要检测函数的局部运行时间的话就可以使用line_profiler了,它可以检测出每行代码的运行时间。
line_profiler是python的非标准库,使用的使用pip的方式安装一下。
pip install line_profiler
最简便的使用方式直接将需要测试的函数加入即可。
def base_func3():
    for n in range(10000):
        print('当前n的值是:{}'.format(n))
from line_profiler import LineProfiler
lp = LineProfiler()
lp_wrap = lp(base_func3)
lp_wrap()
lp.print_stats()
# Line #      Hits         Time  Per Hit   % Time  Line Contents
# ==============================================================
#     72                                           def base_func3():
#     73     10001     162738.0     16.3      4.8      for n in range(10000):
#     74     10000    3207772.0    320.8     95.2          print('当前n的值是:{}'.format(n))
从运行结果可以看出每行代码的运行时间及比例,注意这里的时间单位是微妙。
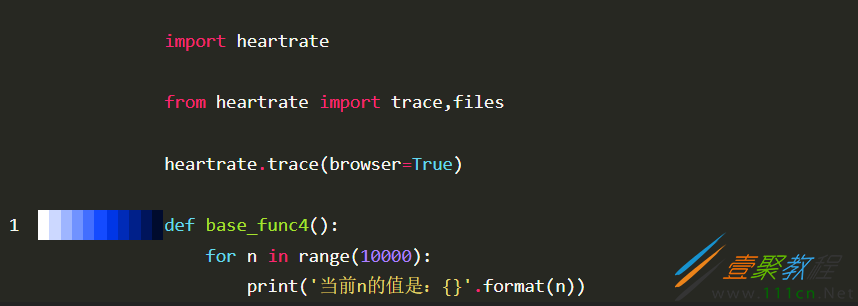
heartrate可视化检测
heartrate最值得推荐的是可以在网页上面向检测心率一样检测程序的执行过程,同时,他还是非标准库,使用pip的方式进行安装。
pip install heartrate
import heartrate
heartrate.trace(browser=True)
def base_func4():
    for n in range(10000):
        print('当前n的值是:{}'.format(n))
运行以后,控制台打印如下日志:
#  * Serving Flask app "heartrate.core" (lazy loading)
#  * Environment: production
#    WARNING: This is a development server. Do not use it in a production deployment.
#    Use a production WSGI server instead.
#  * Debug mode: off
并且自动打开浏览器地址:http://127.0.0.1:9999
相关文章
- 崩坏星穹铁道真理医生专属成就怎么达成 04-23
- 金铲铲之战符文大陆问答答案是什么 04-23
- 女神异闻录夜幕魅影摄影师自救指南怎么做 04-23
- 崩坏星穹铁道寒鸦专属成就怎么达成 04-23
- 逆水寒手游祥瑞混沌坐骑获取流程 04-23
- 崩坏星穹铁道黄黑卡砂阵容推荐 04-23