


最新下载
热门教程
- 1
- 2
- 3
- 4
- 5
- 6
- 7
- 8
- 9
- 10
Python matplotlib如何绘制饼状图 Python matplotlib绘制饼状图功能实例
时间:2022-11-14 23:01:54 编辑:袖梨 来源:一聚教程网
本篇文章小编给大家分享一下Python matplotlib绘制饼状图功能实例,小编觉得挺不错的,现在分享给大家供大家参考,有需要的小伙伴们可以来看看。
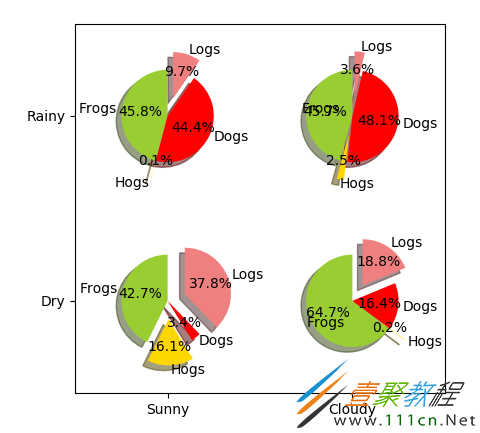
一、代码
import numpy as np
import matplotlib.pyplot as plt
#The slices will be ordered and plotted counter-clockwise.
labels ='Frogs','Hogs','Dogs','Logs'
sizes =[15,30,45,10]
colors =['yellowgreen','gold','#FF0000','lightcoral']
#使饼状图中第2片和第4片裂开
explode =(0,0.1,0,0.1)
fig = plt.figure()
ax = fig.gca()
ax.pie(np.random.random(4), explode=explode, labels=labels, colors=colors,
autopct='%1.1f%%', shadow=True, startangle=90,
radius=0.25, center=(0,0), frame=True)
ax.pie(np.random.random(4), explode=explode, labels=labels, colors=colors,
autopct='%1.1f%%', shadow=True, startangle=90,
radius=0.25, center=(1,1), frame=True)
ax.pie(np.random.random(4), explode=explode, labels=labels, colors=colors,
autopct='%1.1f%%', shadow=True, startangle=90,
radius=0.25, center=(0,1), frame=True)
ax.pie(np.random.random(4), explode=explode, labels=labels, colors=colors,
autopct='%1.1f%%', shadow=True, startangle=90,
radius=0.25, center=(1,0), frame=True)
#设置坐标轴刻度
ax.set_xticks([0,1])
ax.set_yticks([0,1])
#设置坐标轴刻度上显示的标签
ax.set_xticklabels(["Sunny","Cloudy"])
ax.set_yticklabels(["Dry","Rainy"])
#设置坐标轴跨度
ax.set_xlim((-0.5,1.5))
ax.set_ylim((-0.5,1.5))
#设置纵横比相等
ax.set_aspect('equal')
plt.show()
二、运行结果
相关文章
- 江南百景图墨香飘散作诗趣活动奖励介绍 04-20
- 全民学霸破解版无限钻石免广告 04-20
- 归龙潮龙玉获得方法介绍 04-20
- 江南百景图墨香飘散作诗趣活动奖励介绍 江南百景图墨香飘散作诗趣活动奖励有哪些 04-20
- fgo国服提亚马特抽几宝最好 04-20
- 碧蓝航线能代μ兵装怎么获得 04-20